Data Upload
You can upload your measured PV power as a time series — separately for each string of a site. This data is stored permanently and is the basis for Calibration & Monitoring: geometry detection, performance rating and shading analysis.
Active beta. Data upload, calibration and monitoring are in active beta and available only through the pvnode web app — there is no public API for them yet, and results may still be inconsistent. They require a plan that includes calibration.
Where to upload
Open a site in the pvnode web app → your site → the Monitoring tab. Each string has its own upload control: pick the CSV for that string and it is ingested immediately. You can upload data for several strings one after another.
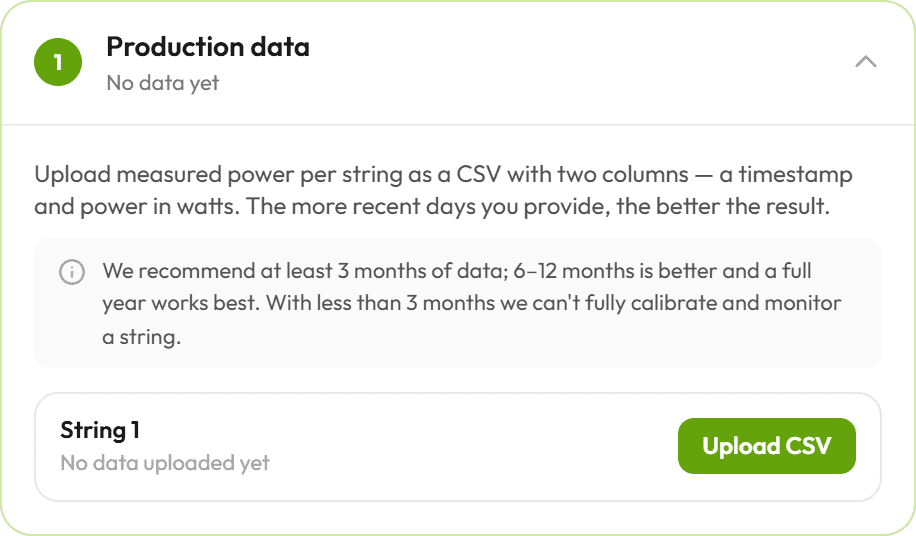
How much data to provide
The more recent history you upload, the better every downstream step works.
| Coverage | What you get |
|---|---|
| < 3 months | Not enough to fully calibrate or rate a string. |
| 3–6 months | Minimum for a usable result. |
| 6–12 months | Better — seasonal angles and shading are captured. |
| Full year | Best — the sun covers its complete path across the sky. |
Further, we recommend data with a granularity of at least 15 minutes per time-step. Everything higher than this might work, but does not deliver the best possible results.
CSV format
A CSV with two columns: a timestamp and the measured pv_power in
watts (the same field name the forecast uses). Only the first two columns are read,
a header row is optional, and the delimiter (; or ,) is detected automatically.
string-measurements.csv
Timestamps & timezone
| Case | Interpretation |
|---|---|
With UTC offset (+02:00, Z) | The offset is used directly. |
| Naive (no offset) | Interpreted in the site's timezone. |
All timestamps are stored internally in UTC, so they stay correct even if you later change the site's timezone.
How the data is processed
- Per string. Each upload belongs to exactly one string of the site.
- Merged into any data already stored — overlapping slots from a newer upload overwrite older values (newest wins). So you can backfill history and top up incrementally without creating duplicates.
- Stored permanently until you delete it (or delete the site).
After an upload, the string row shows how many data points are stored, the covered date range, and a coverage rating. The Data step also charts the last 7 days of uploaded production so you can sanity-check the series.
Limits
| Limit | Behavior |
|---|---|
| File size | Larger than 10 MB is rejected. |
| Row count | More than 600,000 input rows is rejected. |
| Invalid data | A file with no parsable timestamp + watts column is rejected. |
Next step
Once at least one string has data, continue with Calibration & Monitoring to detect each string's true geometry, rate its performance, and map its shading.