Calibration & Monitoring
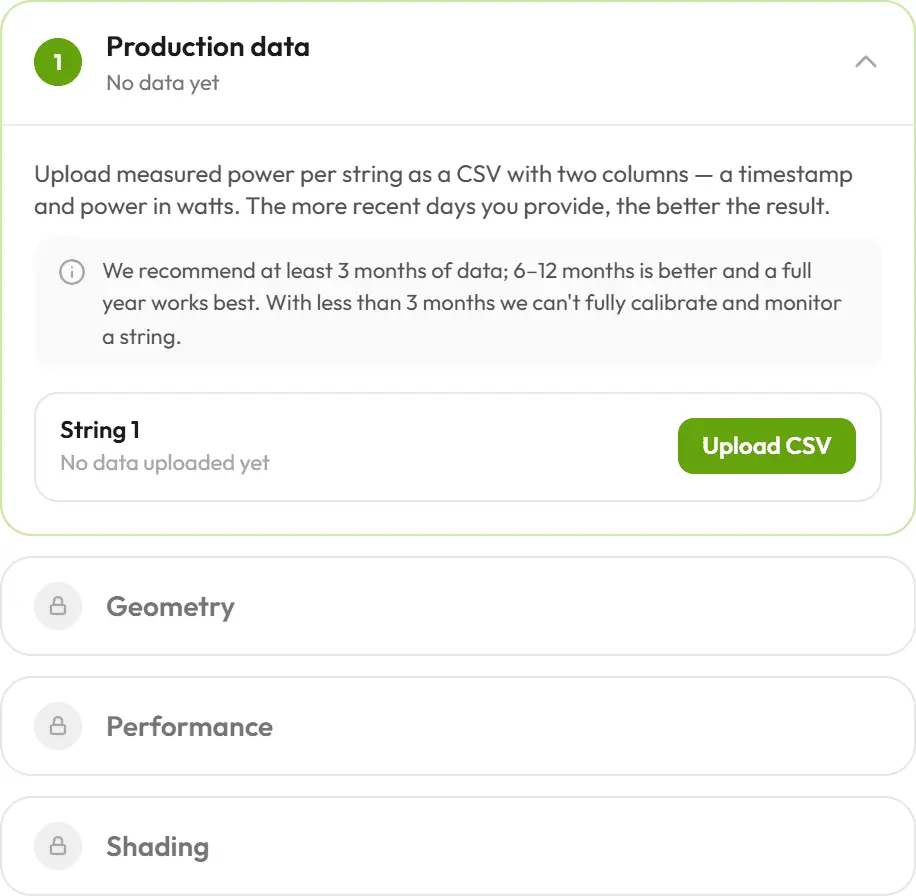
Once you've uploaded measured production for a site, pvnode can learn from it. It runs three steps per string — geometry, performance and shading — and feeds the results back into your forecasts and history so they match how your site really behaves.
Active beta. Calibration and monitoring run only in the pvnode web app (no public API yet) and require a plan that includes calibration. Results may still be inconsistent — if something looks off, let us know.
Where to find it
Open a site in the pvnode web app → your site → the Monitoring tab. The three steps run as a guided pipeline: each unlocks once the previous one has run, and you can re-run any step later (for example after uploading more data).
Code
1. Geometry analysis
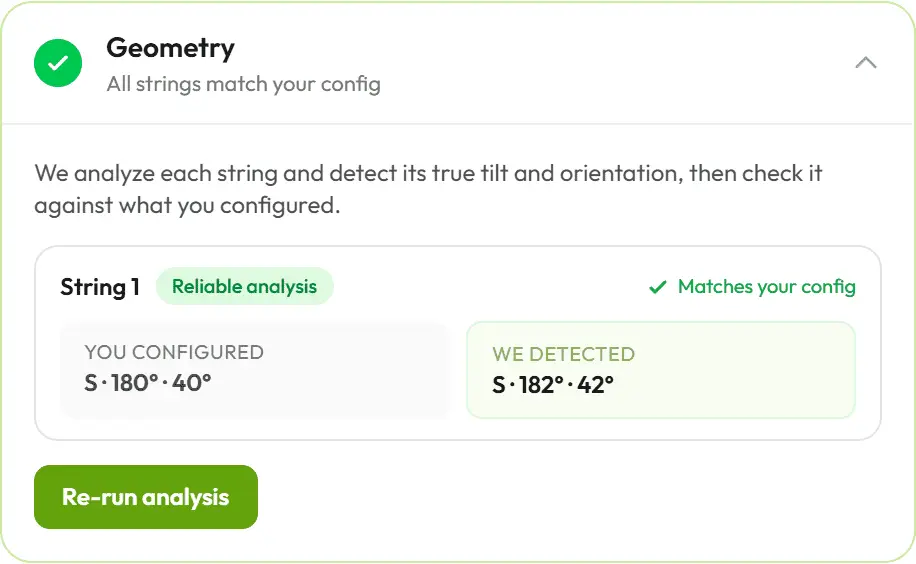
We analyse each string's measured power and reconstruct its true tilt and orientation, then compare that against what you configured.
- If the detected geometry matches your configuration, the string is confirmed.
- If it differs noticeably, you get an Apply detected action to copy the detected tilt and orientation onto the string — or it's a hint that the string's setup, or the uploaded data, isn't quite right.
Each string also gets a fit quality badge (how closely the model matches your data). Good geometry is the foundation for the next two steps.
2. Performance
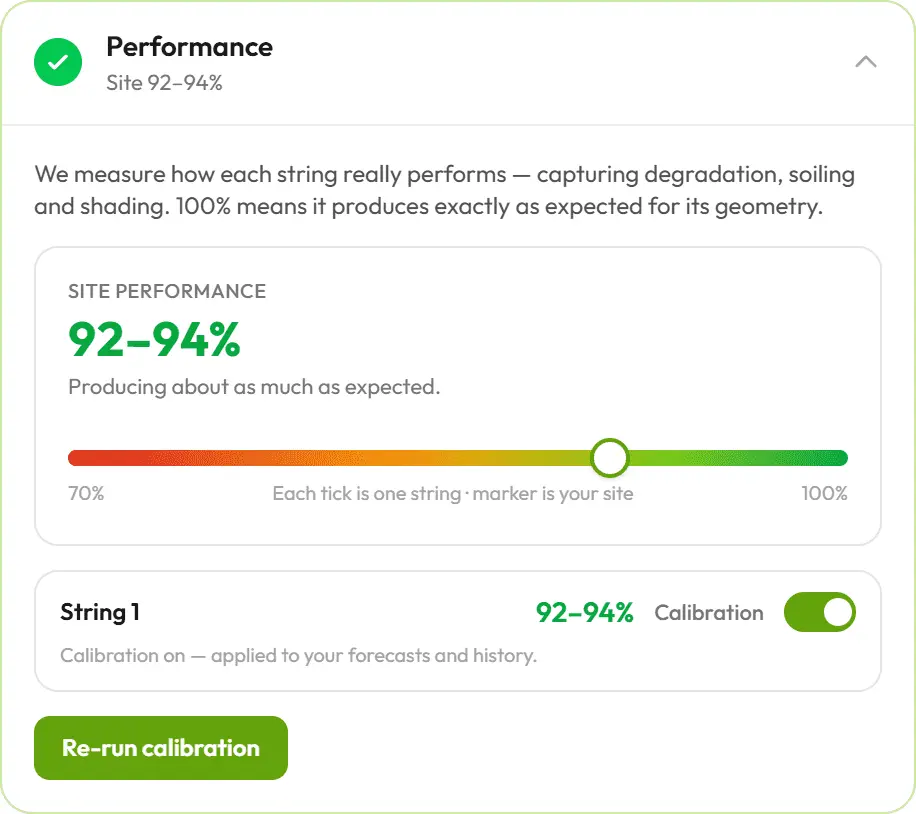
We measure how each string actually performs versus how much it should produce for its geometry. The result is a single rating where 100% means it produces exactly as expected — anything lower captures real-world losses from degradation and soiling.
You see a site-level performance rating and a per-string breakdown:
| Rating | Meaning |
|---|---|
| ~100% | Producing about as much as expected. |
| Slightly low | Producing a little below expected. |
| Well below | Heavy degradation/soiling — or the data is too sparse. |
Strings with less than ~3 months of data are flagged as insufficient and aren't rated until you upload more.
Applying calibration
Each string has a calibration toggle:
- On — the measured correction is applied to that string's forecasts and history, so they reflect its real output.
- Off — the string falls back to its nameplate power with no measured correction.
If a string's configuration changes later, the calibration is marked stale — just re-run this step to refresh it.
3. Shading
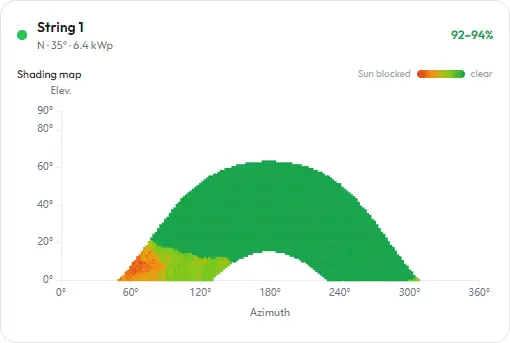
Finally, we build a shading map for each string from the sun's path across the whole year. By comparing expected vs. measured power at every sun position (elevation × azimuth), we reveal where trees, buildings or other obstacles block the sun.
Each string card shows a heatmap: green where the string sees the sun freely, red where it's shaded. A full year of data gives the most complete map, since the sun then covers its entire arc across the sky.
The shading result depends on the performance step, so if you re-run calibration the shading map is marked stale — re-run shading to refresh it.
Putting it together
After all three steps, each string carries its detected geometry, a performance rating and a shading map — surfaced on the per-string monitoring cards at the bottom of the tab. With calibration enabled, this all flows back into your forecasts and historical data, sharpening both to your actual site.