pvnode 2.0 is Here: Forecasts Calibrated to Your Real System, Fixed Sites, and Our Most Advanced Engine in Every Plan
The biggest update in pvnode's history: upload your production to calibrate the forecast to your real system, configure a location once and query it by site_id, get our most advanced engine on every plan, and enjoy limits that scale with your sites. Here's everything that's new in V2.
When we started pvnode, the goal was simple: bring the forecast accuracy that was once reserved for large megawatt parks to every PV system — from a single rooftop to utility scale. Over 85% of all installations are home rooftops under 20 kWp, and for a long time those were exactly the systems that got left out. With V2, we're taking the biggest step yet toward that goal.
The headline of this release is something you'll rarely find anywhere in PV forecasting — at any scale: a forecast you can calibrate to your actual system. Upload your measured production and, in a few guided steps, pvnode detects each array's true geometry, rates its performance, and maps its shading from the sun's own path across the sky — then folds all of that back into your forecasts and history. Plenty of providers predict a number; far fewer learn from your real output, and a shading map drawn from a full year of measured sun positions is rarer still. It's monitoring and calibration built on 20+ years of professional performance assessment — capabilities once reserved for megawatt parks, now available all the way down to a single balcony plant. We'll get to it in depth below.
And that's not the only thing that changed. This is not a cosmetic update: we've rethought how you talk to pvnode, how the engine caches its work, how limits are counted, and how much precision each plan unlocks. The result is an API that's both simpler to use and dramatically less restrictive.
TL;DR
- Calibrated forecasts (new): upload your measured production and pvnode detects each array's geometry, performance and shading, then calibrates your forecasts and history to your real system.
- Fixed Sites: configure a location once, then query it with a short
site_idinstead of stuffing the entire configuration into every request.- Our most advanced engine, now in every plan: the same physical model powers every tier — plans differ in how fresh the forecast is (1, 24, or 144 updates per day) and how deep the data goes.
- More generous limits: the Free plan includes 250 cached forecast requests per month, all paid plans 3,000 — spent freely across all your sites.
- One historical endpoint:
/historyand/recentare merged into a single/historical.- A forecast view for everyone: open a site and you immediately get a forecast-weather view — even without any configuration.
- V1 stays alive until 31 December 2026 — no rush, migrate when you're ready.
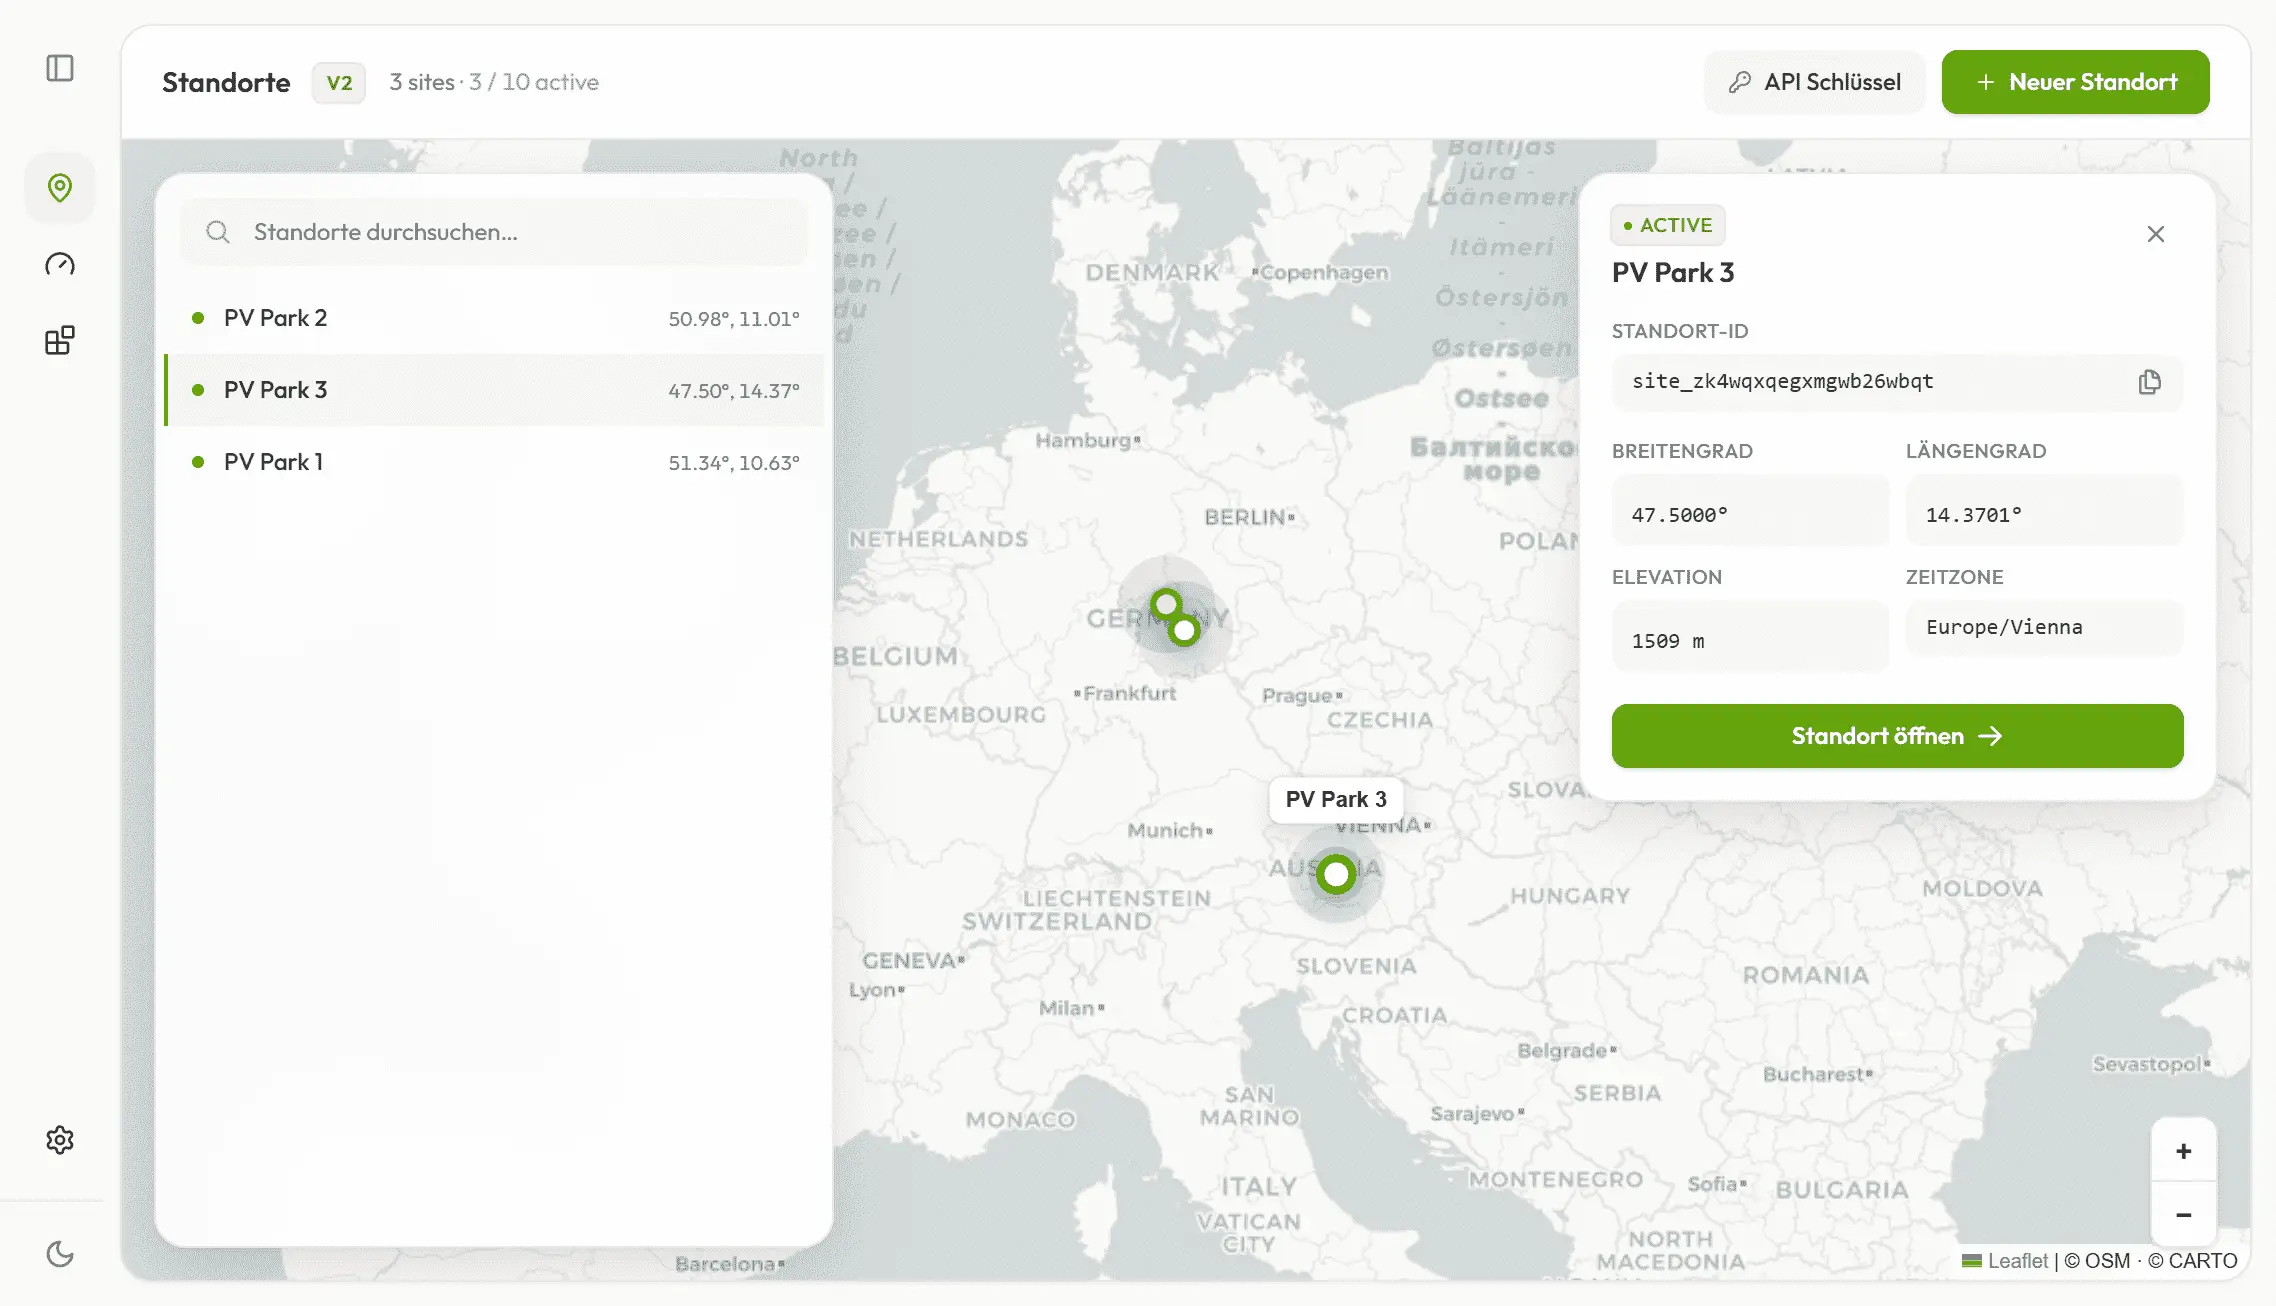
Fixed Sites: Configure Once, Query Forever
In V1, the complete configuration lived inside every single request — coordinates, slope, orientation, module technology, shading, and more. That made requests large and unwieldy, and it capped you at two solar surfaces per request. More surfaces meant more requests.
V2 changes the model entirely. You create a location once, configure it, and pvnode stores everything — including multiple solar surfaces per site. From then on, you query it with nothing but a site_id:
# Forecast in 15-minute resolution
curl "https://api.pvnode.com/v2/forecast/{site_id}" \
     -H "Authorization: Bearer YOUR_API_KEY"

# Historical time series
curl "https://api.pvnode.com/v2/historical/{site_id}" \
     -H "Authorization: Bearer YOUR_API_KEY"
That's it. No more rebuilding the configuration on every call, no more two-surface ceiling. The number of solar surfaces and the number of sites you can store depend on your plan. If you want the full picture, the migration guide maps every V1 parameter to its V2 equivalent.
Our Most Advanced Engine, Now in Every Plan
This is the part we're most proud of. The same physical model now powers every plan. We don't ship a watered-down engine to the free tier and the good one to paying users. Everyone gets terrain-based shading, weather-driven snow losses and real module physics.
What differs between plans isn't the quality of the model, but how fresh the forecast is — how often we recalculate it from current satellite data:
- Free: 1 update per day
- Light: 24 updates per day (hourly)
- Plus: 144 updates per day — recalculated every 10 minutes
That highest tier, every 10 minutes, is what we call nowcasting: the forecast tracks cloud movements in near real time, which is exactly what classic weather models with hourly or three-hourly updates miss. On variably cloudy days, that's where it really earns its keep — for battery charging, EV load shifting, or simply knowing what your system is doing right now. The lower update rates use the same engine; they just refresh less often.
More Generous Limits
The old limits were strict for a reason: V1 recalculated the forecast on every request, which was computationally expensive. The free tier could effectively only query once a day, and more than two solar surfaces made the API impractical.
V2 caches the forecast after it's calculated. Reading the cache is cheap, so we could raise the limits dramatically:
- 250 cached forecast requests per month on the Free plan, 3,000 on every paid plan.
- The pool is shared. Those requests aren't locked to one site each — you spend them dynamically across all your sites, wherever you need the headroom that month.
- Updates (recalculations) are separate and set by your plan's update rate (1 / 24 / 144 per day), not by your request count.
One Historical Endpoint
The two V1 endpoints /history and /recent are now merged into a single /historical. The available time range depends on your plan, but the endpoint is one — fewer concepts to learn, one place to look. (Historical data is part of the Plus plan; Free and Light focus on the forecast.)
A Forecast View for Everyone — Powered by Wanana
Earlier this year we launched a sister app called Wanana: enter a location, optionally configure it, and get a PV forecast up to 7 days out, folded together with high-resolution weather data. Think of it as a weather report for your PV system.
That view is now built right into pvnode. Open a site and you get it automatically as the default view — even without any configuration, right after creating the location. This is what makes the mission real: a useful forecast for every PV owner, regardless of how deep they want to go. Configure nothing and you still get a clear picture. Configure everything and the same view gets sharper.
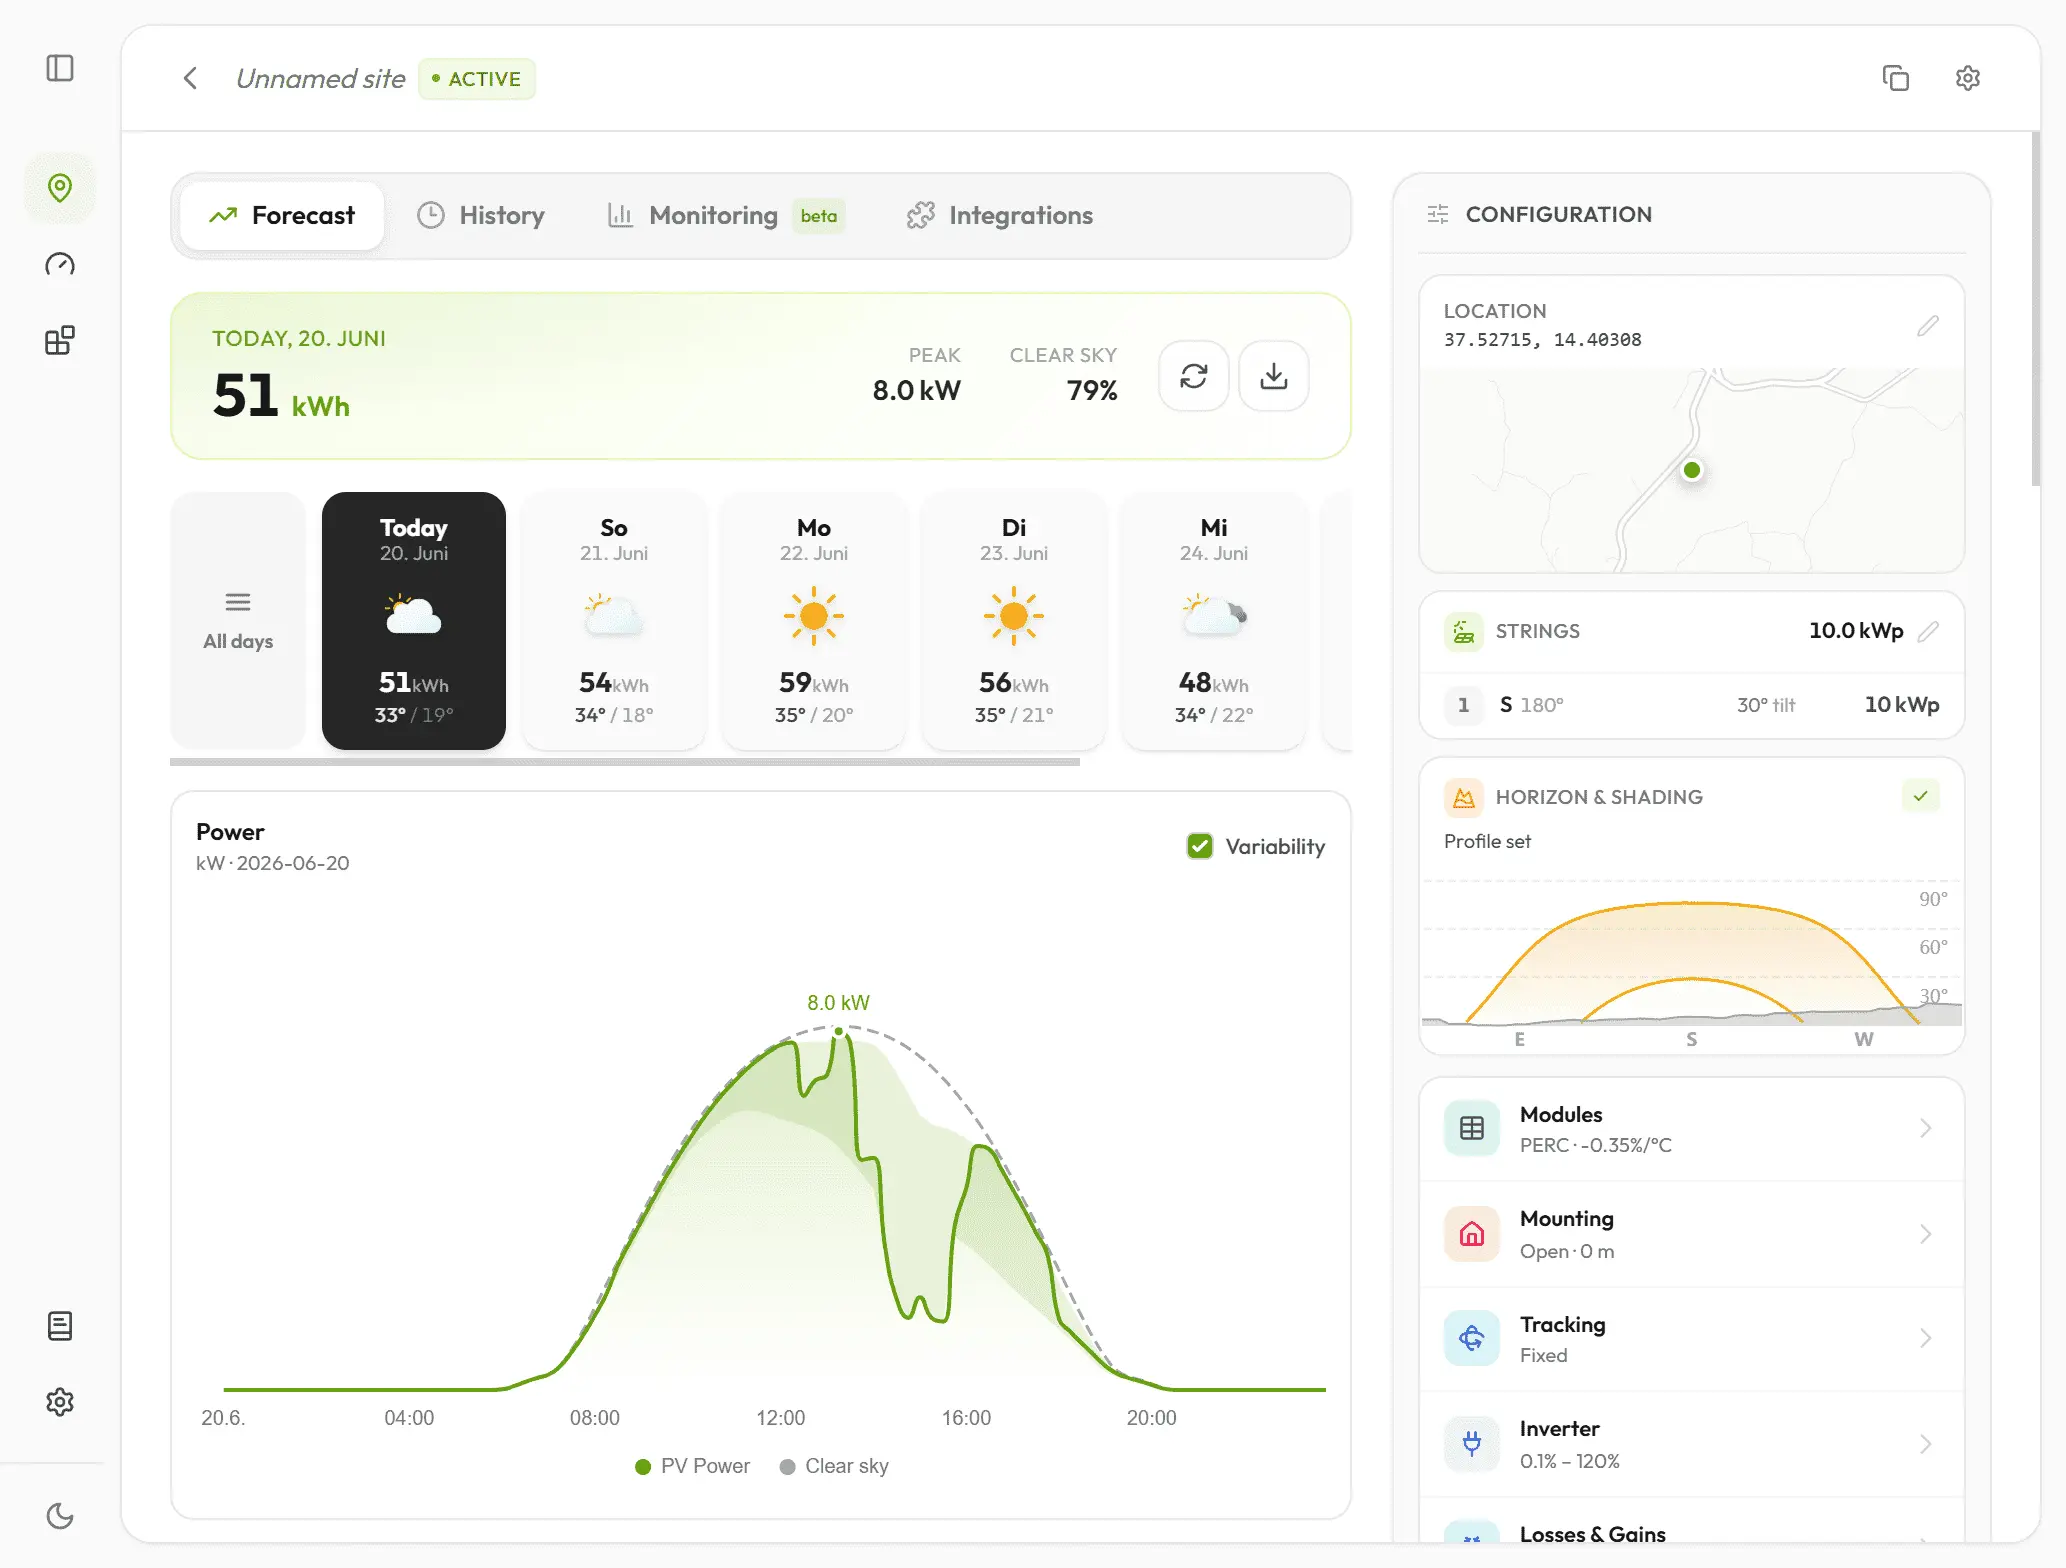
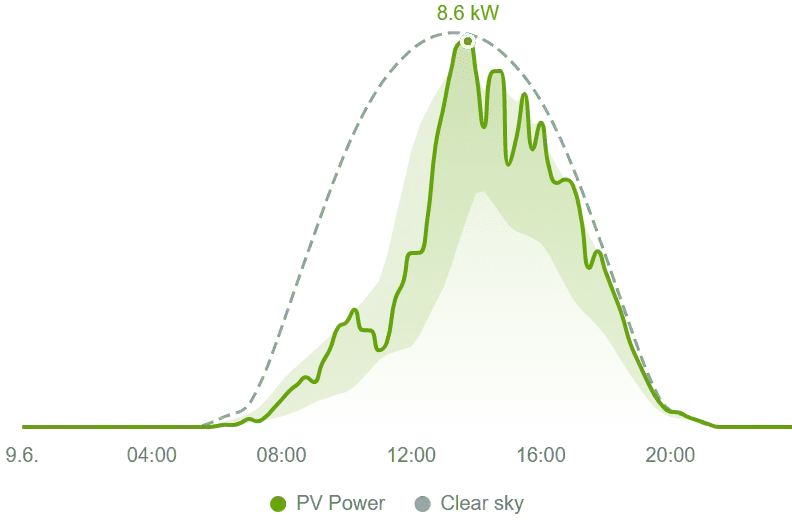
See the Uncertainty: 48-Hour Confidence Band
A forecast is only half the story if you can't see how confident it is. On the Plus plan, the forecast for the first 48 hours — today and tomorrow — comes with a confidence band: the range the actual output is expected to fall within. On a stable day the band is tight; when the weather is uncertain it widens, telling you exactly when to trust the curve and when to leave headroom in your planning.
Via the API it's available through the variability include group:
GET /v2/forecast/{site_id}?include=variability
The V2 Flow in Four Steps
- Create a site — only latitude and longitude are required. In the web app: click the map, or search by address or GPS. You get back a
site_id. - Configure it — number, orientation and power of your solar surfaces, module technology, temperature coefficient, shading, and much more. Even without this step, the API is reachable by
site_idand the forecast-weather view is available. - Query the forecast — by
site_id. Historical time series via API or web app, depending on your plan. - Calibrate the site — upload your measured generation data and let pvnode detect shading, assess performance, and calibrate the forecast to your specific system.
Calibration & Monitoring: Your Forecast Learns Your System
This is the feature we teased at the top — and the one we're most excited about. pvnode already delivers some of the most accurate PV forecasts available, modelled from the real physics of your system. But a forecast that measures itself against your actual production — and especially one that hands you a per-array shading map — is something even most enterprise forecast services don't put in your hands. Calibration takes that a step further: it tunes the forecast to the quirks of your specific system — the permanent shade from a nearby tree or building, the array that has degraded a little faster, the string that's slightly off the orientation you entered. On the Plus plan you upload your measured generation data, and pvnode learns how your site really behaves, then folds that knowledge back into every forecast and your historical data. It builds on 20+ years of experience in performance assessment and fault detection — the kind of monitoring large operators run on their megawatt parks, now available for every system, right down to a single balcony plant.
Active beta. Calibration and monitoring run in the pvnode web app — open a site and go to the Monitoring tab. There's no public API for it yet, and because it's still in beta the results may occasionally look off. It's included on plans with calibration (Plus).
Start by uploading your data
You upload your measured PV power as a time series, separately for each string of a site. The format is deliberately minimal: a CSV with two columns — a timestamp and the measured pv_power in watts (the same field name the forecast uses). The delimiter is detected automatically and a header row is optional.
timestamp;pv_power
2025-06-01T12:00:00+02:00;4200
2025-06-01T12:15:00+02:00;4350
2025-06-01T12:30:00+02:00;4100
The more recent history you provide, the better — a full year is ideal, since the sun then covers its entire arc and every shading angle is captured. Three months is the minimum for a usable result. Uploads merge into what's already stored (newest wins), so you can backfill and top up incrementally.
Three steps, run as a guided pipeline
Once a string has data, pvnode runs three steps per string. Each unlocks the next, and you can re-run any of them later — for example after uploading more data.
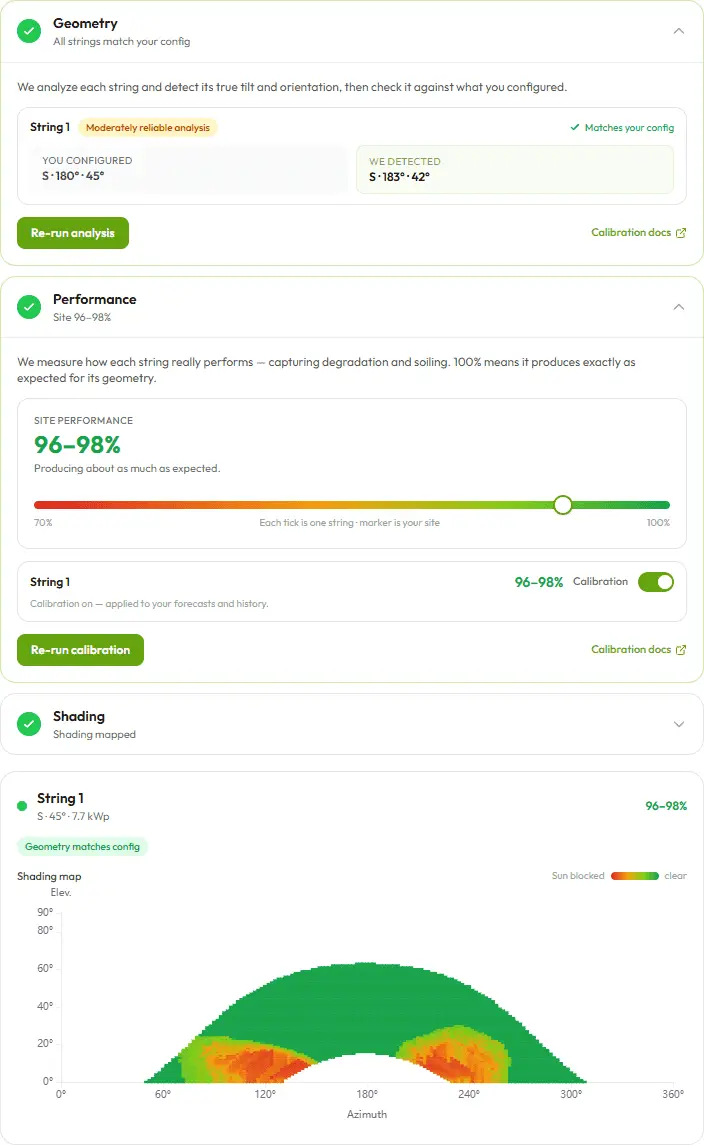
- 1 · Geometry — detected, not guessed. We reconstruct each string's true tilt and orientation straight from its production and compare it to what you configured. If they differ, you get an Apply detected action to copy the real geometry onto the string — or a hint that the setup (or the data) isn't quite right. Good geometry is the foundation for the next two steps.
- 2 · Performance — how your system really performs. We measure how much each string actually produces versus how much it should for its geometry. The result is a single rating where 100% means it's producing exactly as expected — anything lower captures real-world degradation and soiling. You see a site-level rating plus a per-string breakdown. A per-string calibration toggle then applies that correction back to its forecasts and history.
- 3 · Shading — a map from the sky. Finally we build a shading map for each string from the sun's path across the whole year. By comparing expected vs. measured power at every sun position (elevation × azimuth), the heatmap reveals exactly where trees, buildings or other obstacles block the sun — green where the string sees it freely, red where it's shaded.
The payoff: no more manual shading entry, a forecast that gets more accurate over time, and a genuine monitoring signal that tells you when something on your system has changed. Unlike AI-trained models that lump everything together, pvnode separates the causes — geometry, performance, shading — so you know what changed, not just that something did. With calibration enabled, it all flows back into your forecasts and historical data, sharpening both to your actual site.
See the docs for the full walkthrough: Calibration & Monitoring · Data Upload.
The Full Modeling Engine — What Every Plan Shares
To be clear about what "most advanced engine in every plan" means: the physics is identical across tiers. No rough derating factors, just physical models:
- High-resolution satellite irradiance and weather data, fetched automatically — spatial resolution from 1 km², best in Central Europe.
- Terrain-based far shading (25 m EU / 30 m global elevation model), plus row and detailed near shading.
- Realistic, weather-driven snow losses including slide-off behavior — not a flat derating factor.
- Module technologies like PERC, TOPCon and CdTe, with spectral effects, incidence-angle losses, configurable albedo and temperature coefficient.
- Cable losses, inverter clipping, and integrated tracker systems.
It covers everything from a balcony power plant to an enterprise megawatt park. What your plan changes is the freshness (update rate), the horizon (today+tomorrow vs. 7 days), the depth (historical data, confidence band, calibration), and how many sites and solar surfaces you can run.
Three Ways In
V2 is built for very different users, so there are three ways to work with it:
- The forecast-weather view — for anyone who wants to see their forecast and make data-driven decisions, no code required.
- No-code downloads & integrations — download your data or plug pvnode into other tools via an API key, without writing code.
- The REST API — for custom integration into your own systems.
What This Means for V1 Users
No breaking changes are forced on you. The V1 endpoints and pvnode Studio stay active until 31 December 2026 — more than enough time to migrate. V1 will receive bugfixes but no new features, so all the new capabilities live in V2.
Migration is straightforward: create a site in the web app, drop the site_id into your tool, and you're done. The same API key works for both V1 and V2. The migration guide covers the endpoint mapping, the new field names, and local timestamps.
For integrations like Solectrus, EVCC and ioBroker, a V2 update to the respective tool is needed — we're coordinating that with the maintainers and track the progress in the docs. A native Home Assistant integration is also on the way to close the gap left by the current REST-only setup.
Get Started
If you're already using pvnode, you can start creating sites today and explore the new forecast view right away. If you're new, V2 is the ideal moment to jump in: the Free plan gets you a site with just a click on the map and a forecast in under a minute — no credit card required. Step up to Light for the 7-day forecast, or Plus for nowcasting, history, the confidence band, and calibration.
As always, the feedback button in the dashboard goes straight to us — and we're genuinely curious what you'll build on top of V2.
